The Worldwide Leader in Standardized Vision Testing
Criterion for Glaucoma Detection and Measuring Treatment
Summary: Contrast sensitivity is gaining popularity as an adjunct to perimetry for management of glaucoma patients. Clinical use and research studies show that it is sensitive to early vision losses and can track the efficacy of treatment. Indeed, the vast majority of ganglion cells reside in the central vision. Since glaucoma is a disease that causes the death of retinal ganglion cells, a sensitive measure of central vision, like contrast sensitivity, can be very useful in measuring disease presence and progression.
Background:
Assessment of peripheral vision remains the primary visual function measurement for glaucoma detection and progression. Perimetry is the well-established standard of care and is a very important test for many reasons, including high specificity for the vision loss patterns associated with glaucoma. However, standard perimetry, as normally tested using larger spot sizes (III or higher), only measures peripheral vision. Interestingly, new data shows that central vision is affected by glaucoma and these vision changes are not detected by standard perimetry.
The tests offered by the CSV-2000 and CSV-1000, because they provide accurate measures of central contrast sensitivity, can add significant diagnostic and disease evaluation information for the assessment of glaucoma patients. This data is supported by anatomical information of the retina which shows that the vast majority of ganglion cells, more than 70%, reside in the central 5 or 6 degrees. Since glaucoma is a disease that causes the death of retinal ganglion cells, a sensitive measure of central vision can be very useful in measuring ganglion cell dysfunction and in assessing the presence and progression of the disease. Further, studies indicate that central vision changes due to glaucoma, as measured by contrast sensitivity, occur more quickly than peripheral changes as measured by perimetry. These measurements of central contrast sensitivity are useful for earlier detection of vision loss and for tracking the efficacy of glaucoma medication. This advantage of contrast sensitivity is particularly important given the long time frames (often years) needed for perimetry to detect changes in visual function associated with glaucoma and treatment.
The paragraphs below describe a number of studies demonstrating the value of contrast sensitivity for glaucoma evaluation and outline the clinical protocol for using the VectorVision contrast sensitivity tests to better manage glaucoma patients. One of the major advantages of the VectorVision tests is that they provide a very quick, repeatable and reliable test for standardized contrast sensitivity. Patient testing requires 2 minutes or less per eye. When evaluating glaucoma patients, it is best to test all four spatial frequencies of contrast sensitivity, Rows A, B, C and D (spatial frequencies 3, 6, 12 and 18 cycles per degree, respectively).
Useful in Two Ways
Contrast sensitivity (CS) is very useful in two areas of glaucoma evaluation. Data now shows that prior to treatment, glaucoma patients exhibit abnormal contrast sensitivity and this abnormality can be used to assess the presence or progression of the disease. Following treatment, 60 to 70% of the patients show clinically significant improvements in CS. Contrast sensitivity can be used to evaluate the patient response to the initiation of therapy or to a change in therapy.
Use of Contrast Sensitivity for Glaucoma
Contrast Sensitivity Aids in Establishing the Presence of Glaucomatous Vision Loss Prior to Treatment
Clinical use has isolated three primary criteria which can be used to determine whether a glaucoma suspect has abnormal contrast sensitivity prior to treatment. Example graphs of these criteria are shown below. All three criteria are based on the patient being tested with best correction such that any vision loss detected by contrast sensitivity is not due to refractive error.
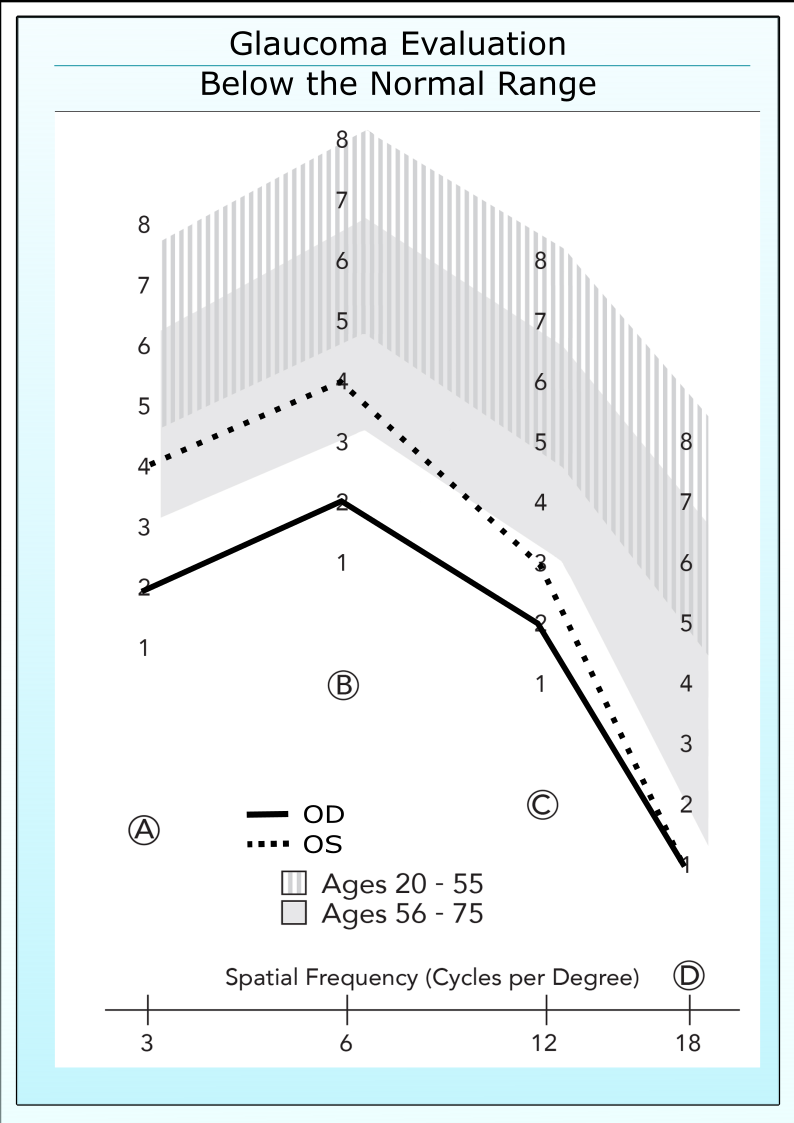
Below the Normal Range
Untreated glaucoma patient with contrast sensitivity below the normal range.
If a patient has good acuity, 20/30 or better, then he or she should have good contrast sensitivity. One hallmark of early glaucoma is that patients fall outside the normal range (patch 3 or below in either Row B or Row C), even when acuity remains normal. An example is shown on the left. It is important to keep in mind that this criteria can be confounded by the presence of other eye diseases, such as cataracts, diabetes or macular degeneration. If a glaucoma suspect presents with other eye diseases, then this criteria must be used with caution.
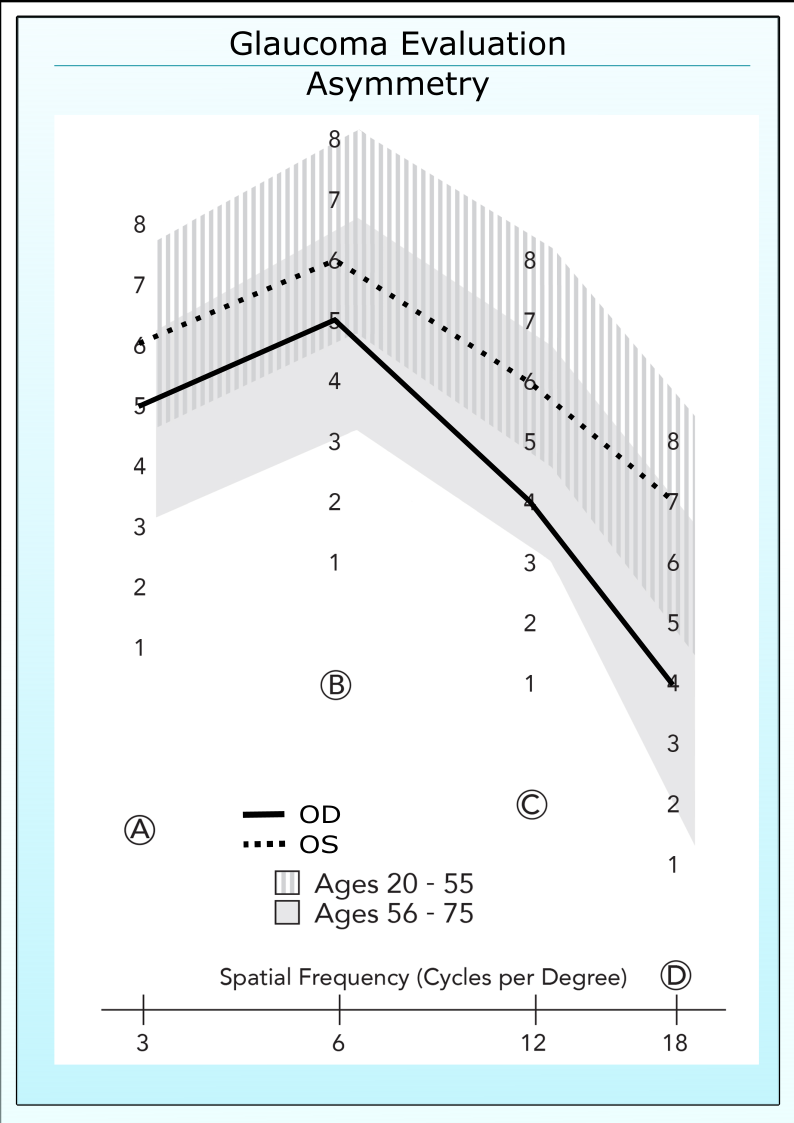
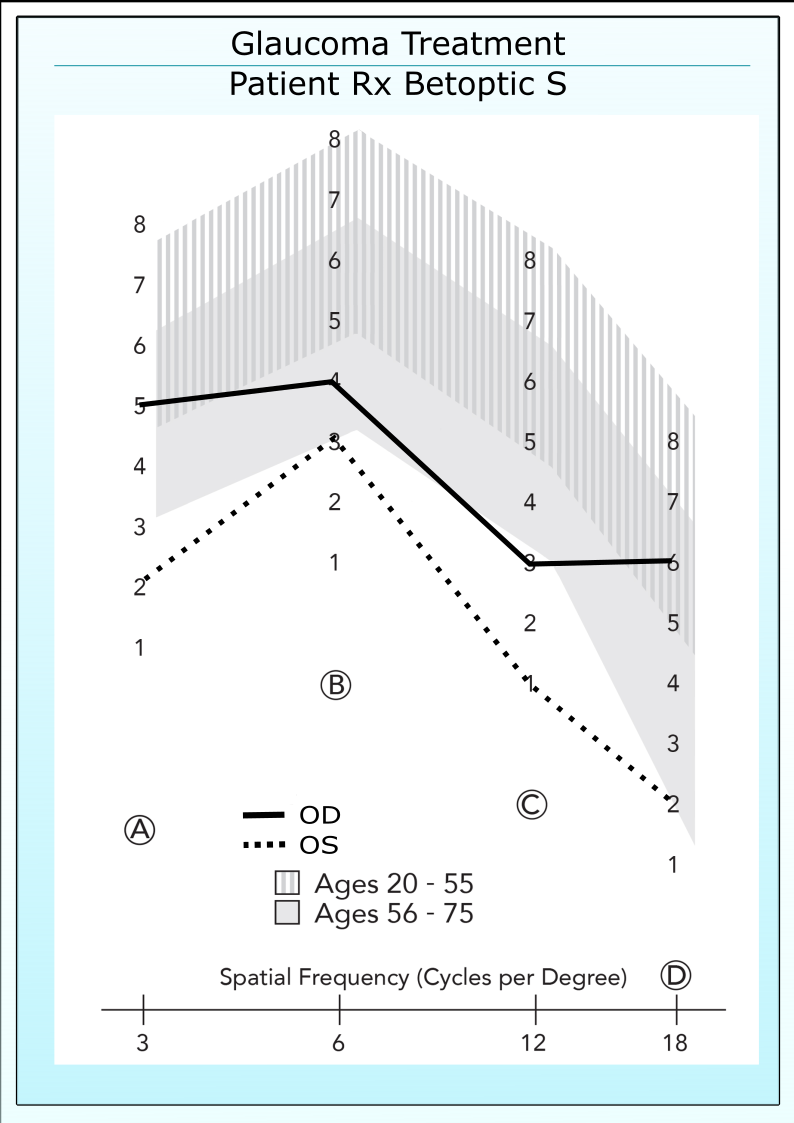
Asymmetry in Contrast Sensitivity
Glaucoma patients often exhibit asymmetry in contrast sensitivity between eyes, even though both eyes fall within the normal range.
A difference between eyes or asymmetry in CS is an early indicator of disease progression in glaucoma, particularly if the asymmetry occurs in Rows B and C. The example below shows a typical patient with asymmetry in contrast sensitivity, no field loss and equivocal appearance of the optic nerve head. A difference between eyes of 2 contrast levels or more is considered a significant asymmetry.
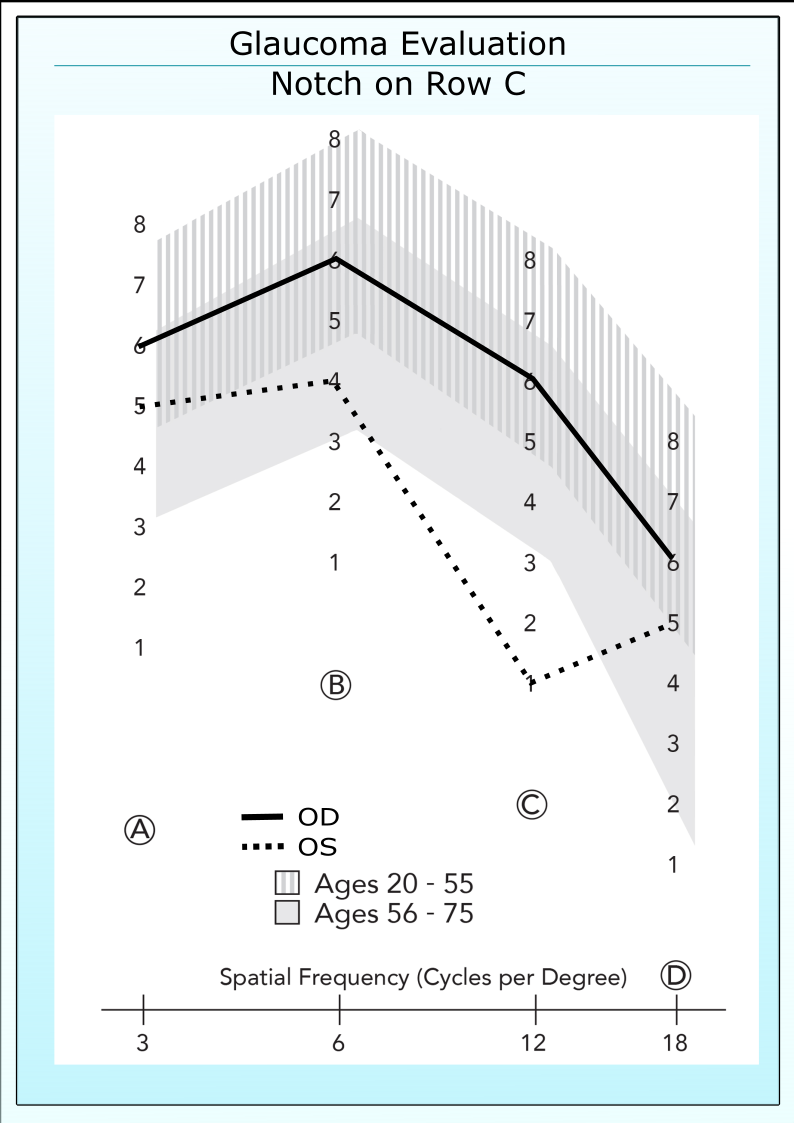
Irregular Shaped CS Curve
Before treatment, a notch often appears in contrast sensitivity in one or both eyes.
Clinical use has demonstrated the presence of an irregularly shaped contrast sensitivity curves in approximately 30 to 50% of untreated glaucoma patients. This abnormal shape most often appears in Row C, but also has been documented to occur in Row B. An example is shown below. The irregular curve shape criteria is perhaps the most powerful indicator of early disease because other eye diseases such as cataracts, diabetes and macular degeneration have not been shown to cause a similar pattern in contrast sensitivity.
Typically, a glaucoma patient will present with a contrast deficit which matches more than one criteria. It is not unusual for a patient to present with all three; CS below the normal range, asymmetry between eyes and an irregular shaped curve. When more than one criteria is present for the patient, the probability is higher that the patient has progressing disease.
Retest the Patient if a Deficit is Found
All psychophysical tests, such as perimetry and threshold contrast sensitivity, suffer inaccuracies from patient fatigue and learning. If a patient presents with a CS deficit, that patient should be immediately retested on CS to insure the presence of the deficit. Also, the refractive status of the patient should be evaluated to insure that the loss in vision is not the result of inadequate optical correction.
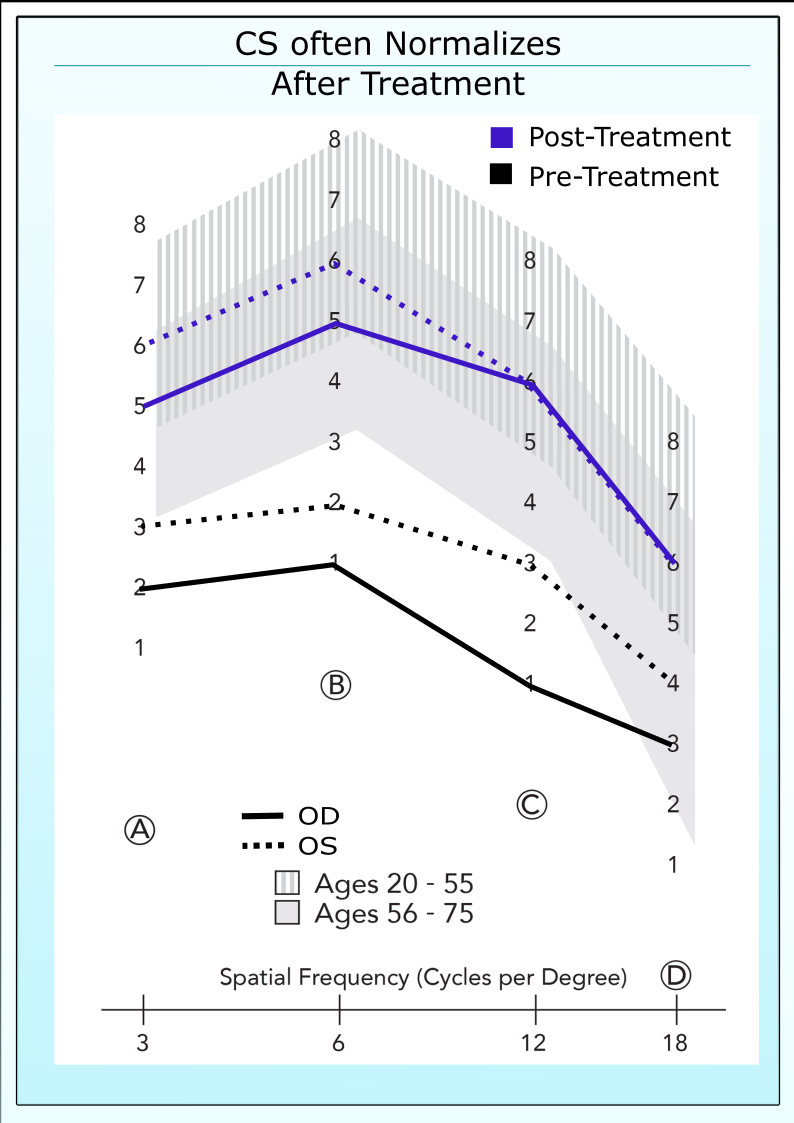
Measuring Improvements Following Glaucoma Treatment
The above graph shows the contrast sensitivity of a glaucoma patient before and after initiation of ocular hypotensive therapy
Research and clinical data shows that 60 to 70% of glaucoma patients demonstrate reliable improvements in contrast sensitivity within 1 to 2 months of starting medical treatment (Pomerance and Evans. IOVS August 1994). This percentage may be higher in patients who undergo surgical treatment of glaucoma, but the data is still unclear in this area. These improvements are predictable and can be used clinically as a criterion to determine the efficacy of therapy.
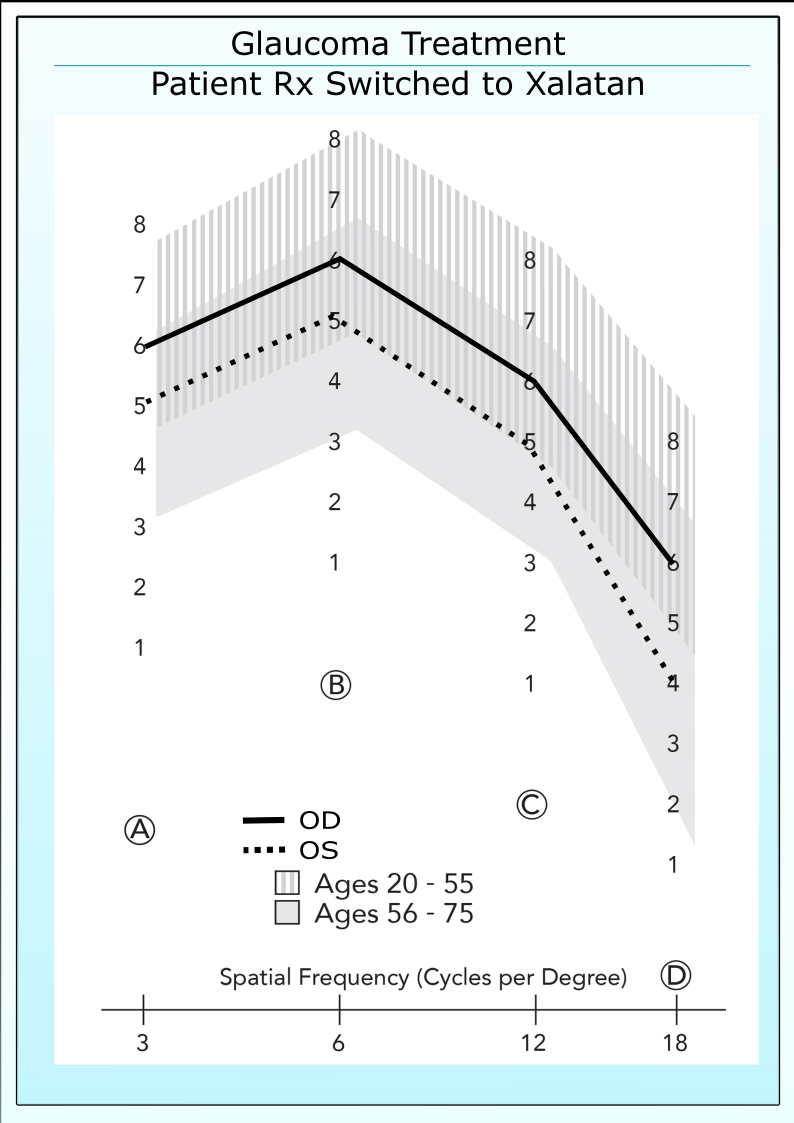
Change in Treatment
Contrast sensitivity can also be used to determine if a change in treatment is beneficial. This example shows the improvement in CS following a change in treatment, from a beta blocker to a prostaglandin analogue. (This example is a specific clinical case for one patient and is not intended to imply in any way that treatment with a prostaglandin analogue provides for better contrast sensitivity than treatment with a beta blocking agent. Other specific clinical case reports will appear in future updates of our website showing the opposite case. Current research is ongoing to aid in delineating which types of patients exhibit more improvement with each type of medication.)
The left figure shows the contrast sensitivity (CS) for both eyes of a glaucoma patient who has been treated for 3 years with Betoptic S (IOP: OD/OS 17/20). Note that both eyes are below the normal range. The right figure shows the CS of the same patient after switching to three months of treatment with Xalatan (IOP: OD/OS 13/15). Note that both eyes have increased into the normal range. The appearance of the patient’s superior/inferior arcuate scotoma OD and early inferior arcuate scotoma OS did not change with treatment (Data provided by Dr David Stewart).
Better Management of Glaucoma Therapy
Clinical use shows that in many patients, treatment can be better managed if contrast sensitivity is added to the evaluation process (i.e. visual field, optic disc appearance and IOP). If a patient exhibits a CS deficit which matches one of the three pretreatment criteria described above, then a goal of treatment should be to eliminate this CS deficit. For example, if the patient presents with an irregular shaped curve in Row C and an asymmetry between eyes, then a possible goal of treatment would be to extinguish these CS deficits. Additionally, a two contrast level improvement in CS is considered clinically significant. In cases where a complete reversal of the CS deficit(s) cannot be obtained, then a secondary goal of treatment would be to obtain a two contrast level improvement.
Patients should be evaluated with best correction. A change in correction between visits can cause a shift in contrast sensitivity that is unrelated to the disease state.
Normal Contrast Sensitivity May Indicate that the Patient is Under Therapeutic Control
After a glaucoma patient has been properly treated, it is not unusual for that patient to exhibit normal levels of contrast sensitivity. If a treated patient has normal CS, then it is inappropriate to conclude that glaucoma has no impact on that patient’s central vision, only that the impact is being successfully offset by treatment. These patients should be monitored to ascertain if any reductions in CS occur over time, potentially indicating a reduction in treatment efficacy or possibly a lack of patient compliance.
Compliance With Glaucoma Medication
Contrast Sensitivity is commonly used by many clinicians to ascertain the level of patient compliance with medical treatment. Many times, patients discontinue use of the glaucoma treatment and only “drop their medication” on the morning before the visit to the eye doctor. The IOP measurement for these patients indicates proper compliance. However, if the patient has not been compliant, the CS will remain low. Four to 6 weeks of consistent medical treatment are normally required to fully affect the improvement in CS. The CS test can also be used to demonstrate to patients the impact of poor compliance.
Data from SLT Study Shows Definite Recovery of CS
Stefano Gandolfi and his colleagues from Italy measured contrast sensitivity on patients who had unilateral glaucoma before and after the diseased eye was treated with laser trabeculoplasty. This study is particularly interesting because patients had unilateral disease, allowing researchers the ability to use the normal eye for comparison to the treated glaucomatous eye over a three-year period.
They found that patients showed significant reductions in CS compared to the normal eye before treatment, even though there was no loss in visual field sensitivity and only marginal neural rim thinning in the eyes with elevated IOP. After treatment, CS recovered to near normal levels after a 9 month period and remained stable until the end of the study at 36 months.
Interestingly, the full IOP reduction took place within three months of treatment, but the full contrast sensitivity recovery occurred over a 9 month period. This time lag between the IOP reduction and CS improvement suggests that the ganglion cells were damaged (ie “sick”) and after the insult was removed, the cells healed and CS recovered. Further, the results indicate that the improvements in CS after treatment are not directly related to elevated IOP, but are related to the health of the optic nerve and ganglion cells. See graph above. If the CS changes were directly related to elevated IOP, then CS and IOP changes would have occurred concurrently in time. It is unknown whether elevated IOP was directly causing damage to the ganglion cells or if the insult was caused by other factors, such as apoptosis, reduced blood flow, reduced axonal transport, etc. A number of studies have shown changes in CS following treatment when there has been no change in IOP.
It is also interesting to note that prior to treatment, the CS in the diseased eyes was very depressed compared to the normal eyes. But after recovery, the CS of the diseased eyes had increased to a level very similar to the normal eyes. This result suggests that patients should be tested with CS before treatment, or a change in treatment, so that a baseline CS can be established in glaucoma patients.
What Causes the Improvement in Contrast Sensitivity?
Many clinicians and several research reports have noted that the improvements in contrast sensitivity following glaucoma treatment are not correlated to change in IOP (Pomerance and Evans. IOVS Aug 1994; Harris et al. AJO Oct 1997). That is, in some patients a small change in IOP is associated with a very large change in contrast sensitivity, whereas in other patients, treatment which provides for a large change in IOP provides for a diminutive or no change in CS. Vigorous research is now ongoing to determine the cause of improvement in CS following glaucoma treatment. Several authors have suggested that changes in ocular circulation or in neuroprotective activity are related to the improvements in central vision.
Change in Blood Flow May be Related to Change in Visual Function
The bar plots show the changes in blood flow velocity in the ophthalmic artery of normal tension glaucoma patients following six months of treatment with a calcium channel blocking agent (nifedipine). The 16 patients in the study have been broken into two groups; a contrast sensitivity responder group in which each patient demonstrated an improvement of two contrast levels or greater in contrast sensitivity (0.3 log units) and a contrast sensitivity nonresponder group in which no patient demonstrated an improvement in CS following treatment. Neither group showed a change in IOP. In this study, only one eye was evaluated for changes in ocular circulation and visual function.
Note that the CS responder group displayed on average an improvement in blood flow velocity while the nonresponder group showed a decrease in the velocity measures. This data suggests that contrast sensitivity may be useful for predicting which patients respond favorably to glaucoma treatment. (Graphs adapted from Harris et al. AJO Nov 1997).
These bar charts show the change in peak systolic velocity (PSV) and end diastolic velocity (EDV) in the ophthalmic artery of normal tension glaucoma patients following 6 months of treatment with oral nifedipine. The two groups are broken down by contrast sensitivity response. Each of the patients in the responder group showed a significant improvement in CS while the patients in the nonresponder group showed either no change or a decrease.
The left graphs show the change in contrast sensitivity of a patient from the CS responder group. Her contrast sensitivity improved dramatically from outside to inside the normal range. Her blood flow velocity in the ophthalmic artery as measured by color Doppler imaging increased nearly 70%. The right graph shows the change in contrast sensitivity of the worse patient in the CS nonresponder group. Her CS fell during treatment and the ophthalmic artery velocity also fell dramatically (> 90%). (Contrast Data From Evans et al. ARVO Abstract 1996).
Featured Product
CSV-2000
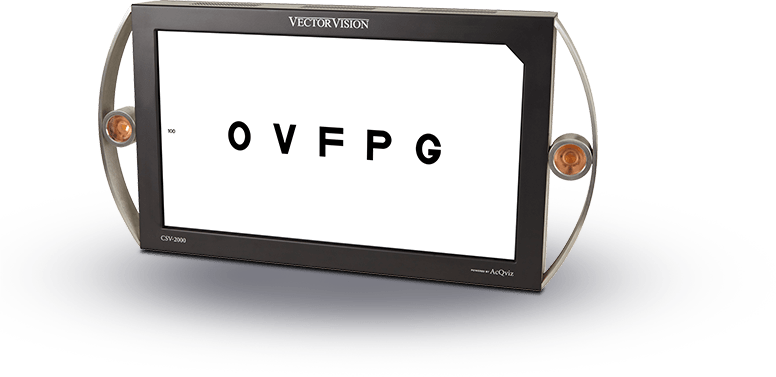
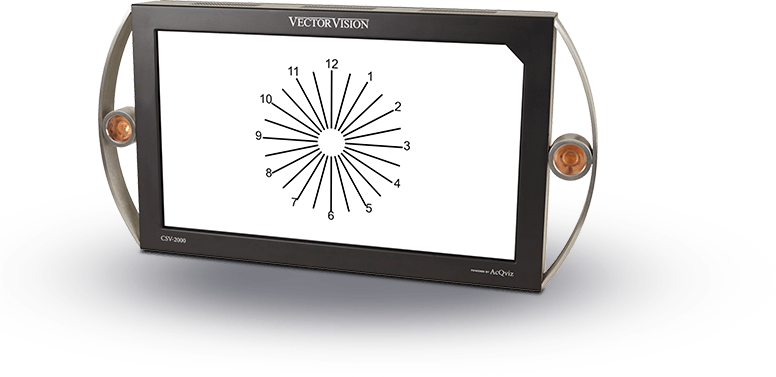
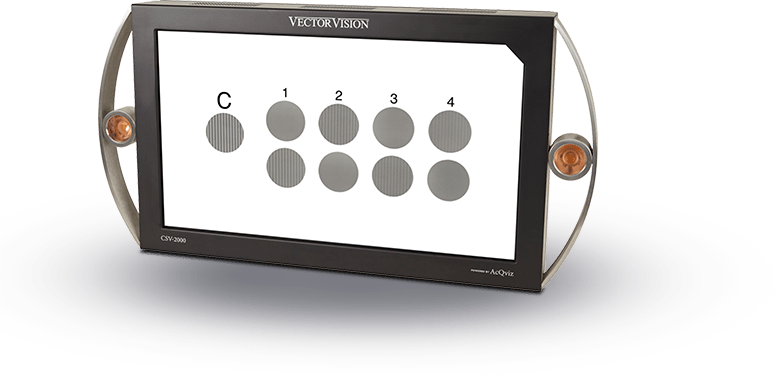
CSV-2000 The first and only all-in-one digital vision testing device that offers the full range of vision tests, along with STANDARDIZED contrast sensitivity, glare and visual acuity.
AcQviz Auto-Calibration
Includes the patented AcQviz technology that automatically measures monitor luminance and adjusts testing to the recognized FDA vision testing luminance standard of 85 cd/m2.
Standardized to the testing light level recommended by the FDA and ANSI
Easy-to-use remote control allows rapid integration into patient flow
Full Range of Vision Tests
Includes the full range of vision tests, including acuity, astigmatism, convergence, color, depth, etc. and the proprietary VectorVision contrast sensitivity and glare tests.
Standardized to the testing light level recommended by the FDA and ANSI
Easy-to-use remote control allows rapid integration into patient flow
Uses the same contrast and spatial frequency range that is validated by more than 100 scientific papers and provides the only published population age-norms.
Standardized to the testing light level recommended by the FDA and ANSI
Easy-to-use remote control allows rapid integration into patient flow
Rapid Testing
Remote control provides the ability to easily switch between tests. All tests are designed specifically for a computerized format, thus making testing fast and easy.
Standardized to the testing light level recommended by the FDA and ANSI
Easy-to-use remote control allows rapid integration into patient flow
Why VectorVision?®
As treatments evolve, so must the testing technology
Over the last 20 years, VectorVision testing equipment has become the worldwide benchmark for standardized contrast sensitivity, glare and ETDRS acuity testing.
 Contrast sensitivity can also be used to determine if a change in treatment is beneficial. This example shows the improvement in CS following a change in treatment, from a beta blocker to a prostaglandin analogue. (This example is a specific clinical case for one patient and is not intended to imply in any way that treatment with a prostaglandin analogue provides for better contrast sensitivity than treatment with a beta blocking agent. Other specific clinical case reports will appear in future updates of our website showing the opposite case. Current research is ongoing to aid in delineating which types of patients exhibit more improvement with each type of medication.)
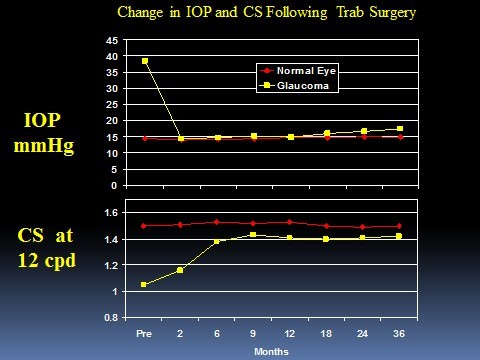 Stefano Gandolfi and his colleagues from Italy measured contrast sensitivity on patients who had unilateral glaucoma before and after the diseased eye was treated with laser trabeculoplasty. This study is particularly interesting because patients had unilateral disease, allowing researchers the ability to use the normal eye for comparison to the treated glaucomatous eye over a three-year period.
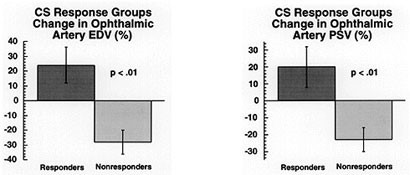 The bar plots show the changes in blood flow velocity in the ophthalmic artery of normal tension glaucoma patients following six months of treatment with a calcium channel blocking agent (nifedipine). The 16 patients in the study have been broken into two groups; a contrast sensitivity responder group in which each patient demonstrated an improvement of two contrast levels or greater in contrast sensitivity (0.3 log units) and a contrast sensitivity nonresponder group in which no patient demonstrated an improvement in CS following treatment. Neither group showed a change in IOP. In this study, only one eye was evaluated for changes in ocular circulation and visual function.
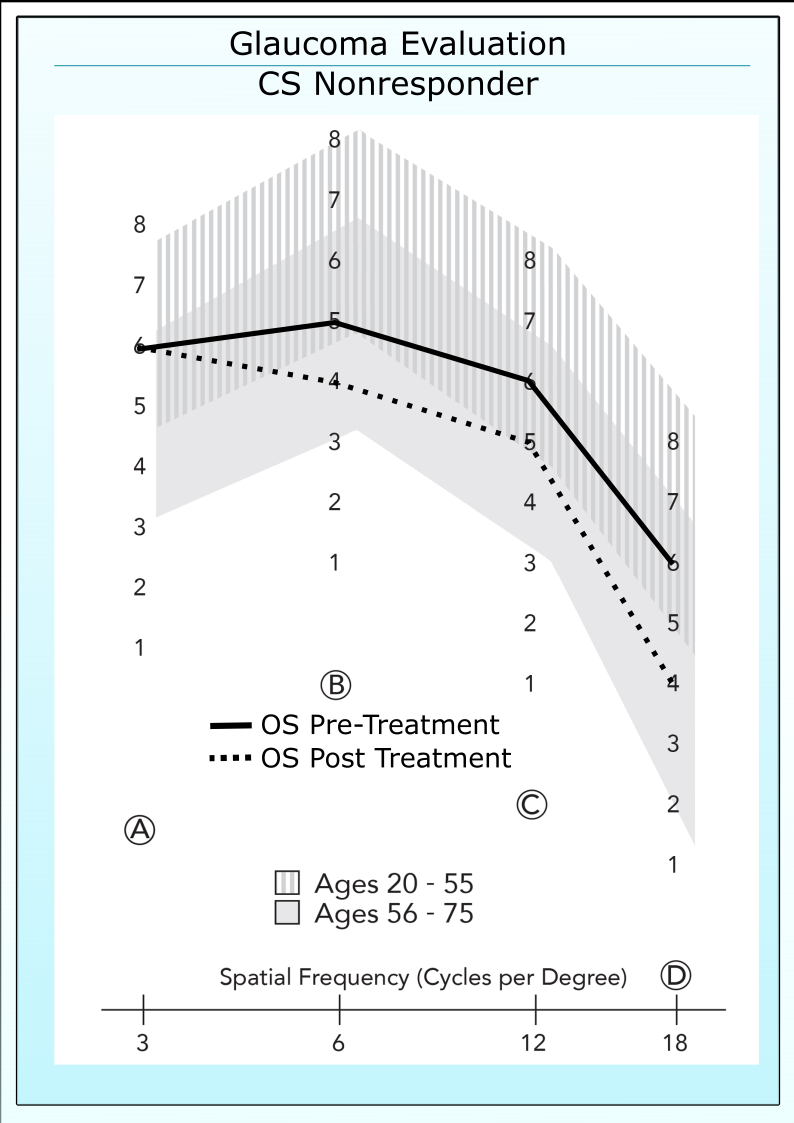
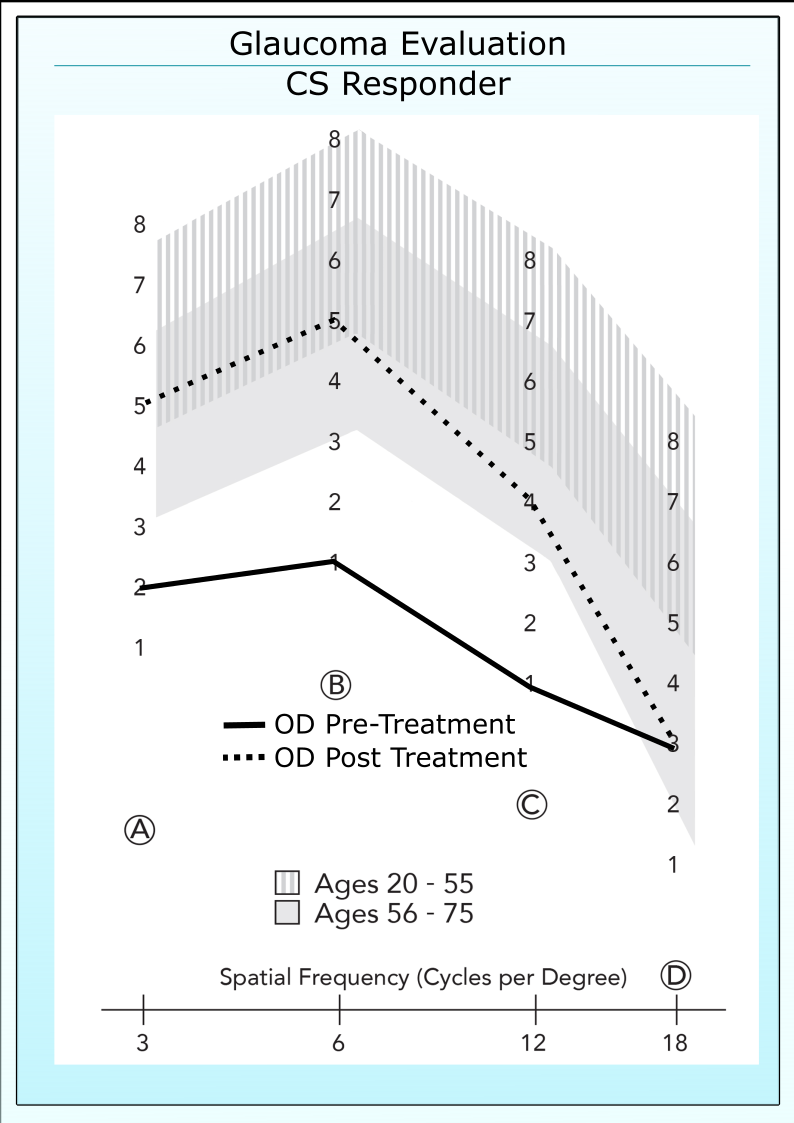 The left graphs show the change in contrast sensitivity of a patient from the CS responder group. Her contrast sensitivity improved dramatically from outside to inside the normal range. Her blood flow velocity in the ophthalmic artery as measured by color Doppler imaging increased nearly 70%. The right graph shows the change in contrast sensitivity of the worse patient in the CS nonresponder group. Her CS fell during treatment and the ophthalmic artery velocity also fell dramatically (> 90%). (Contrast Data From Evans et al. ARVO Abstract 1996).