Population Values for VectorVision Contrast Sensitivity
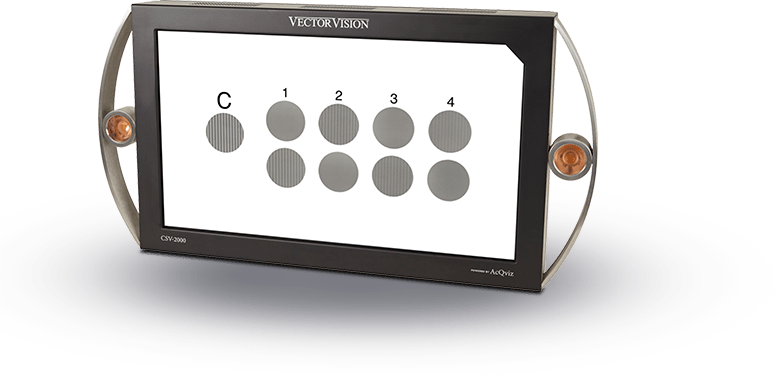
This page shows the linear and log contrast sensitivity values for the contrast levels used on the VectorVision standardized contrast sensitivity tests (CSV-1000 and CSV-2000). Shown lower on the page are the population normal values for the VectorVision tests for a variety of age groups. Normal values for mesopic contrast sensitivity are also provided.
Contrast Sensitivity Values For VectorVision Test
The following tables show the contrast sensitivity values for both linear and log format. For statistical analysis, use of the log values is recommended.
Contrast Sensitivity Values
| S | 1 | 2 | 3 | 4 | 5 | 6 | 7 | 8 | |
|---|---|---|---|---|---|---|---|---|---|
|
Row (CPD) |
|||||||||
| A (3.0) |
5 |
10 | 15 | 22 | 31 | 43 | 61 | 85 | 120 |
| B (6.0) |
8 |
16 |
24 | 36 | 50 | 70 | 99 | 138 |
193 |
| C (12.0) |
4 |
8 |
12 | 18 | 25 | 35 | 50 | 70 |
99 |
| D (18.0) | 1.5 | 3 | 4.5 | 7 | 9.5 | 13 | 18 | 25 |
36 |
Contrast Sensitivity Values in Log Units
| S | 1 | 2 | 3 | 4 | 5 | 6 | 7 | 8 | |
|---|---|---|---|---|---|---|---|---|---|
|
Row (CPD) |
|||||||||
| A (3.0) |
.70 |
1 | 1.17 | 1.34 | 1.49 | 1.63 | 1.78 | 1.93 |
2.08 |
| B (6.0) |
.91 |
1.21 | 1.38 | 1.55 | 1.70 | 1.84 | 1.99 | 2.14 |
2.29 |
| C (12.0) |
.61 |
.91 | 1.08 | 1.25 | 1.40 | 1.54 | 1.69 | 1.84 |
1.99 |
| D (18.0) |
.17 |
.47 | .64 | .81 | .96 | 1.10 | 1.25 | 1.4 |
1.55 |
No zero value exists on a logarithmic scale. For research purposes, do not enter a zero in your data if the patient cannot see the first grating (sample grating). To obtain a log value if no gratings are visible, subtract .3 log from the lowest score on rows A, B and C. (i.e. Row A .4, Row B .61, Row C .31). For Row D, use .01 log, or essentially 100% contrast.
Contrast Sensitivity Values for Normal Population
Population Norms for Younger Age Groups
(Children Age Group: 6 – 10 and 11 – 19 Years of Age):
The table below provides population normal values for children between the ages of 6 to 10 years old and 11 to 19 years old. This data was collected as part of a larger study in which Prof J. Krasny and colleagues from the Department of Ophthalmology, University Hospital in the Czech Republic studied the usefulness of the VectorVision contrast sensitivity test to detect early ocular changes in children.*
Ages 6 to 10
| Spatial Frequency | Average | Standard Deviation |
|---|---|---|
| Row A (3 cpd) |
1.82 (Contrast level 6) |
.13 |
| Row B (6 cpd) |
2.04 (Contrast level 6) |
.14 |
| Row C (12 cpd) |
1.74 (Contrast level 6) |
.11 |
| Row D (18 cpd) |
1.29 (Contrast level 6) |
.11 |
Ages 11 to 19
| Spatial Frequency | Average | Standard Deviation |
|---|---|---|
| Row A (3 cpd) |
1.92 (Contrast level 6) |
.09 |
| Row B (6 cpd) |
2.19 (Contrast level 7) |
.12 |
| Row C (12 cpd) |
1.89 (Contrast level 7) |
.10 |
| Row D (18 cpd) |
1.42 (Contrast level 7) |
.12 |
* Čes. a slov. Oftal., 62, 2006, No. 6, p. 372 – 380.
Population Norms
(Younger Age Group: 20 – 55 Years of Age):
The following tables show data collected as base line (preoperative) measurements in an FDA clinical trial for refractive surgery. These results are based on the evaluation of 156 normal eyes (79 patients) with an age range of 21 – 55 years of age (36.6 yo + 9.02 years). Average preoperative acuity for these patients was 20/16 + 2.35 (number of letters: 45.07 + 3.08).
Photopic Conditions
| Spatial Frequency | Log Average (Contrast Level) |
Standard Deviation |
|---|---|---|
| Row A (3 cpd) |
1.84 (6.38) |
.14 (0.93) |
| Row B (6 cpd) |
2.09 (6.67) |
.16 (1.08) |
| Row C (12 cpd) |
1.76 (6.46) |
.17 (1.15) |
|
Row D (18 cpd) |
1.33 (6.50) |
.19 (1.31) |
Mesopic Conditions
| Spatial Frequency | Log Average (Contrast Level) |
Standard Deviation |
|---|---|---|
| Row A (3 cpd) |
1.61 (4.85) |
.21 (1.43) |
| Row B (6 cpd) |
1.66 (3.77) |
.23 (1.50) |
| Row C (12 cpd) |
1.08 (2.33) |
.32 (1.56) |
|
Row D (18 cpd) |
0.56 (1.97) |
.35 (1.52) |
Population Norms*
(Older Age Group: 50 – 75 Years of Age):
| Spatial Frequency | Average | Standard Deviation |
|---|---|---|
| Row A (3 cpd) |
1.56 (Contrast level 4) |
.15 |
| Row B (6 cpd) |
1.80 (Contrast level 5) |
.165 |
| Row C (12 cpd) |
1.50 (Contrast level 5) |
.15 |
| Row D (18 cpd) |
.93 (Contrast level 4) |
.25 |
*Pomerance G, Evans D. Test-Retest Reliability of the CSV-1000 Contrast Test and Its Relationship to Glaucoma Therapy. Invest Ophthalmol Vis Sci. 1994. 35(9); 3357-3361.
Test for 1.5 cycles/degree for evaluation of mesopic contrast sensitivity or low vision
The CSV-1000-1.5cpd is a special test face designed for FDA clinical trials and for low vision assessment. The following provides the answer key for this test face and the contrast values in log units.
Answer Key
| S | 1 | 2 | 3 | 4 | 5 | 6 | 7 | 8 |
|---|---|---|---|---|---|---|---|---|
|
B |
A | A | B | B | B | A |
A |
Contrast Sensitivity Values for the CSV-1000-1.5cpd in Log Units
| S | 1 | 2 | 3 | 4 | 5 | 6 | 7 | 8 |
|---|---|---|---|---|---|---|---|---|
|
.60 |
.90 | 1.07 | 1.22 | 1.37 | 1.52 | 1.67 | 1.82 |
1.97 |
The CSV-1000-1.5cpd has been adopted for the FDA clinical trials to evaluate mesopic contrast sensitivity testing and mesopic glare sensitivity testing for refractive surgery and certain intraocular lenses (IOLs). If there are any questions concerning the use of the CSV-1000 instrument for mesopic contrast or glare testing, please contact us.


